Multi-agentic architectures can pose challenges from an observability perspective. Each agent within a workflow makes its calls to its own toolset and each agent may be configured to use a different underlying LLM (or even a Model Router which picks the most efficient model for us). Being able to observe which agent made what call with which model in a unified manner can be challenging over an entire workflow.
OpenTelemetry provides semantic conventions that help us solve this problem and Microsoft Foundry provides tracing integrations for agent frameworks that enable us to implement tracing for different agentic frameworks, and assist us in quickly identifying root causes for issues in our agents.
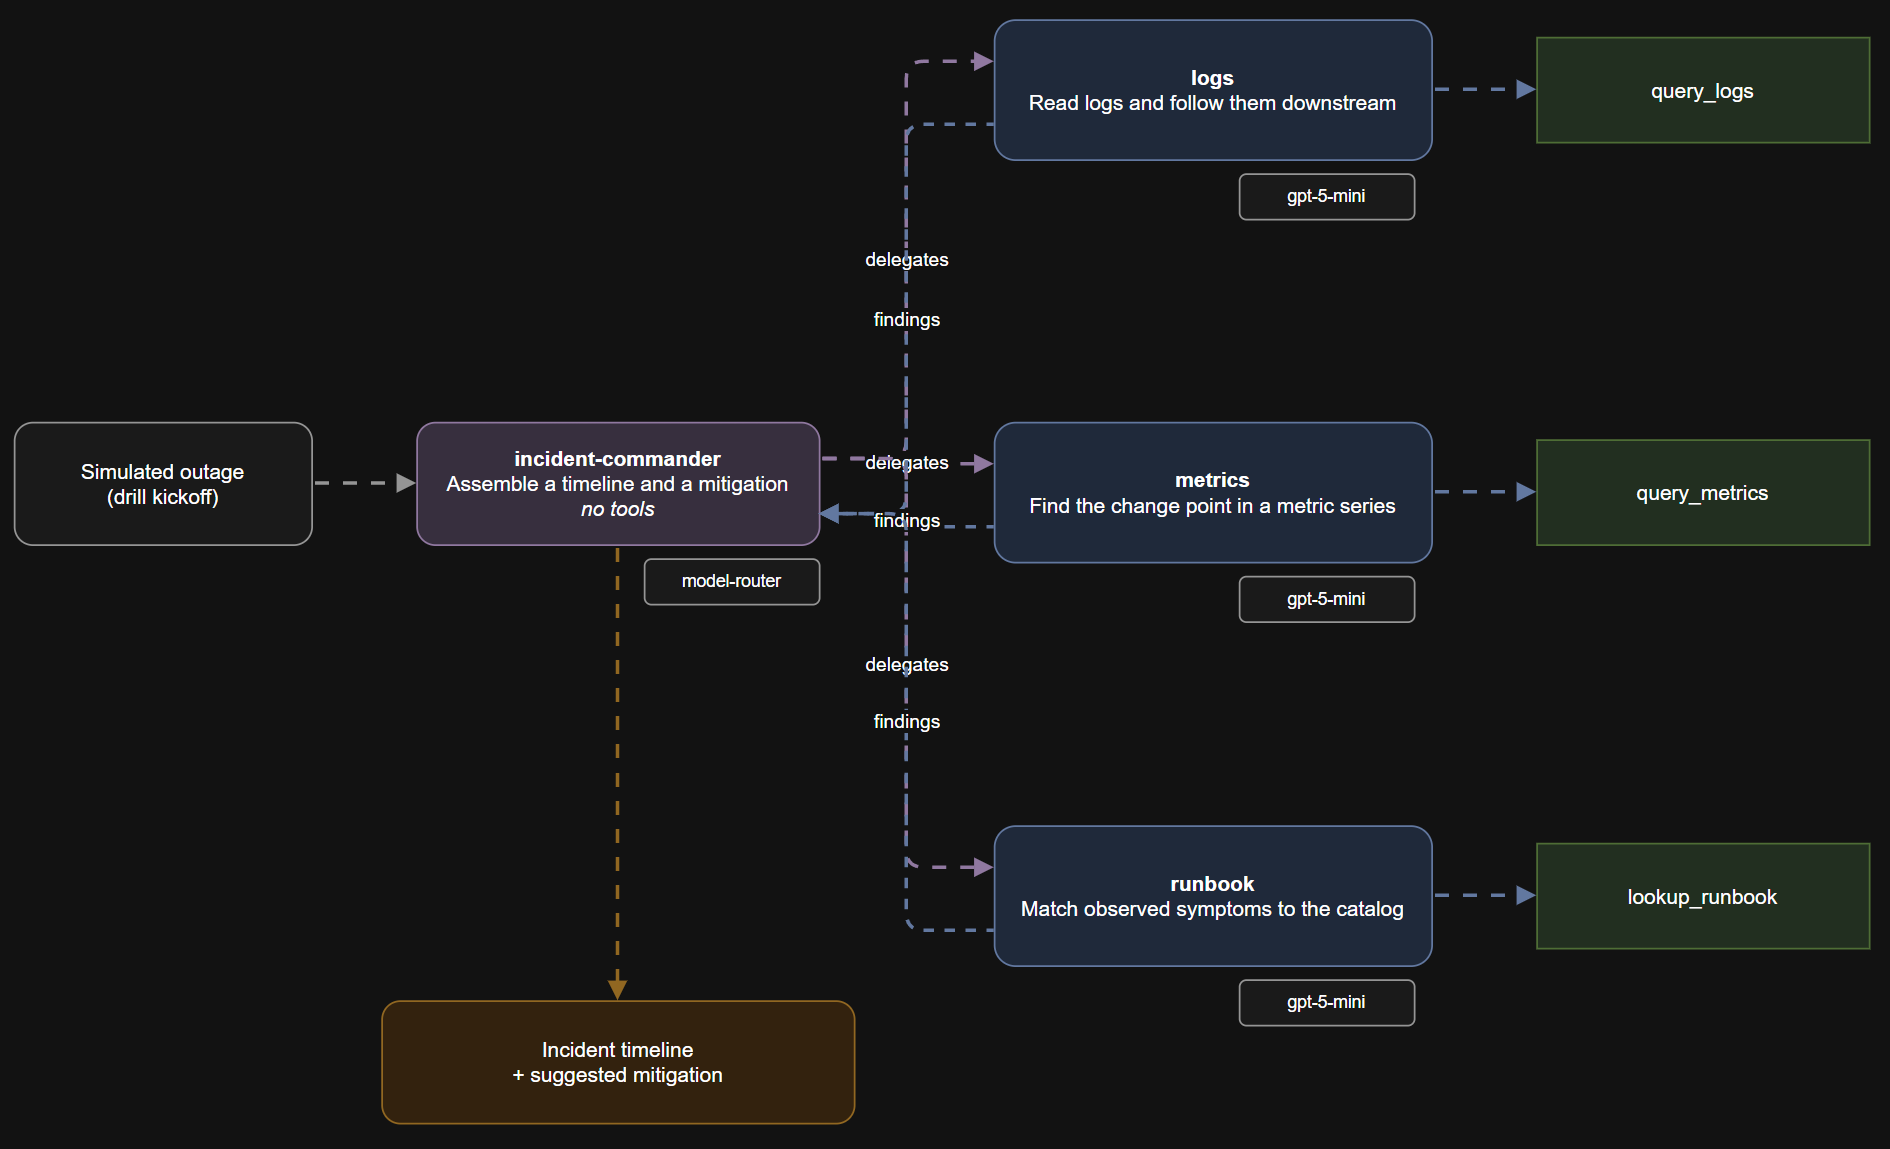
Imagine we have a multi-agent solution for an incident drill runner. We use this to run chaos engineering drills and a crew of agents investigates a simulated outage in the same way an on-call roster would do. We have an agent for an incident commander who fans out to a Logs specialist, a Metrics specialist, and a Runbook specialist who all investigate the simulated outage. They report back to the incident commander, who then assembles the timeline of the incident and provides a suggested solution.
Each specialist agent is configured with its own tool:
| Agent | Job | Tool | Deployment |
|---|---|---|---|
logs |
Read logs and follow them downstream | query_logs |
gpt-5-mini |
metrics |
Find the change point in a metric series | query_metrics |
gpt-5-mini |
runbook |
Match observed symptoms to the catalog | lookup_runbook |
gpt-5-mini |
incident-commander |
Assemble a timeline and a mitigation | none | model-router |
N.B. The incident-commander uses the model-router deployment. If you’re running the sample yourself, you will notice different gen_ai.response.model values for different runs. If you want to learn more about how Model Routing works, check out this video on YouTube
The flow looks something like the following:
In this article, we’ll discuss how distributed observability works for multi-agent systems, how we can propagate context across agents within our workflow, dive a little deeper into the OpenTelemetry Semantic Conventions for GenAI, and how we can implement observability in our agents and Microsoft Foundry so that we have a unified view across our agents.
If you want to take a look at the code while reading the article, you can view the complete sample here.
I’ve also made a YouTube video for this too! Check it out 👇
What does distributed observability mean for multi-agent systems?
Multiple agents can be invoked as part of an agentic workflow, with each agent making calls to its own tools and different LLMs. Agent-to-agent calls and tool chains mean that per-agent observability isn’t enough to get a complete picture of what happened, we need to have a connected trace across the whole system.
OpenTelemetry provides a standardized protocol for collecting and routing telemetry data. Microsoft Foundry uses OpenTelemetry semantic conventions to provide consistency across tools and integrations. Within Foundry, tracing captures information such as user inputs and agent outputs, tool usage, token consumption, and time signals such as duration and latency.
There are a couple of OpenTelemetry concepts we should discuss before moving on. Traces ’trace’ the journey of a request or workflow through your application by recording events and state changes (which can include function calls, and system events). Spans are the building blocks of traces. They represent a single operation within a trace, and capture start and end times, attributes, and can be nested to show hierarchical relationships so we can see the full call stack and sequence of operations. Attributes are essentially key-value pairs attached to traces and spans, and provide contextual metadata.
How does it work?
Propagating context across agents
For multi-agentic systems, span context contains both a trace ID and span ID. The span context gets propagated across agent boundaries using the W3C Trace Context standard.
When a receiving agent takes the context, it will create a child span with the same trace ID, but create a new span ID. If the agent needs to call any downstream agents, the context will be propagated. Without this, each agent would create a new trace ID, and we’d lose the correlation.
For our incident drill simulator, one drill would be one trace. Our span is opened when the commander is invoked and the drill scenario is created.
with drill_context(
    id=drill_id,
    incident_id=incident_id,
    service=service,
    scenario=scenario,
    mode=mode,
):
    with get_tracer().start_as_current_span("game_day_drill", kind=SpanKind.SERVER) as root:
        brief = _brief(scenario, service, symptoms)

        findings = await asyncio.gather(
            *(_delegate(crew, role, brief) for role in Role)
        )

        report, severity, model = await _assemble(crew, brief, findings)
The with drill_context() attaches Baggage, which is a key-value store which lets you propagate any data we like alongside context. The trace is created in the with get_tracer().start_as_current_span() statement. as_current means that the span is created and it gets installed in the context. Any span started inside that block becomes a child of root, which uses the same trace ID, but its own span ID.
The SpanKind.SERVER value for the kind parameter starts the SERVER span deliberately. Without this, Application Insights has nothing to use as the start of a transaction, so we need to set this in order to see the end-to-end view.
In order to give our processor a rule for what to copy, we can provide a BAGGAGE_PREFIX namespace so that our key id becomes drill.id like so:
BAGGAGE_PREFIX = "drill."
Next, we need to set the Baggage. In OTel, contexts are immutable, so we use the set_baggage method to return a new context rather than modifying each one:
@contextmanager
def drill_context(**entries: str) -> Iterator[None]:
    ctx = context.get_current()
    for key, value in entries.items():
        ctx = baggage.set_baggage(f"{BAGGAGE_PREFIX}{key}", value, context=ctx)
    token = context.attach(ctx)
    try:
        yield
    finally:
        context.detach(token)
Baggage lives in the context, while attributes live in the spans. To bring them together, we need to use a span processor to hook the start of the span, and then use a BaggageSpanProcessor to copy the matching baggage across as attributes:
def _install_baggage_processor() -> bool:
    provider = trace.get_tracer_provider()
    add_span_processor = getattr(provider, "add_span_processor", None)
    if add_span_processor is None:
        return False
    add_span_processor(BaggageSpanProcessor(lambda key: key.startswith(BAGGAGE_PREFIX)))
    return True
The GenAI semantic conventions
The OpenTelemetry semantic conventions define a common set of semantic attributes which provide meaning to data when collecting, producing and consuming it. As far as agents are concerned, OpenTelemetry has conventions for spans, metrics, and events for GenAI clients, MCP servers and provider-specific (For example, OpenAI LLMs) conventions
Different namespaces exist for different attributes. For example, gen_ai.* has key attributes like gen_ai.agent.name, gen_ai.agent.id, gen_ai.operation.name, gen_ai.usage.*. Underneath those attributes, there are well known values. For example gen_ai.operation.name has values such as invoke_agent, execute_tool, execute_task, agent_to_agent_interaction.
Standardised conventions provide us consistency across different agentic frameworks, so you can use the same tracing standards for agents that use Microsoft Agent Framework and agents that use LangChain, OpenAI Agents SDK etc.
The Microsoft Agent Framework instruments invoke_agent, chat, and execute_tool automatically. However, when we need to trace when the Commander agent hands work to our specialist, we need to implement that ourselves.
This is what happens inside _delegate(), the function our asyncio.gather calls once per specialist:
with get_tracer().start_as_current_span(
    "agent_to_agent_interaction",
    kind=SpanKind.CLIENT,
    attributes={
        "gen_ai.operation.name": "agent_to_agent_interaction",
        "gen_ai.agent.name": agent.name,
        "game_day.from_agent": COMMANDER_NAME,
        "game_day.to_agent": agent.name,
        "game_day.role": role.value,
    },
) as span:
    response = await agent.run(f"{brief}\n\n{SPECIALIST_ANGLE[role]}")
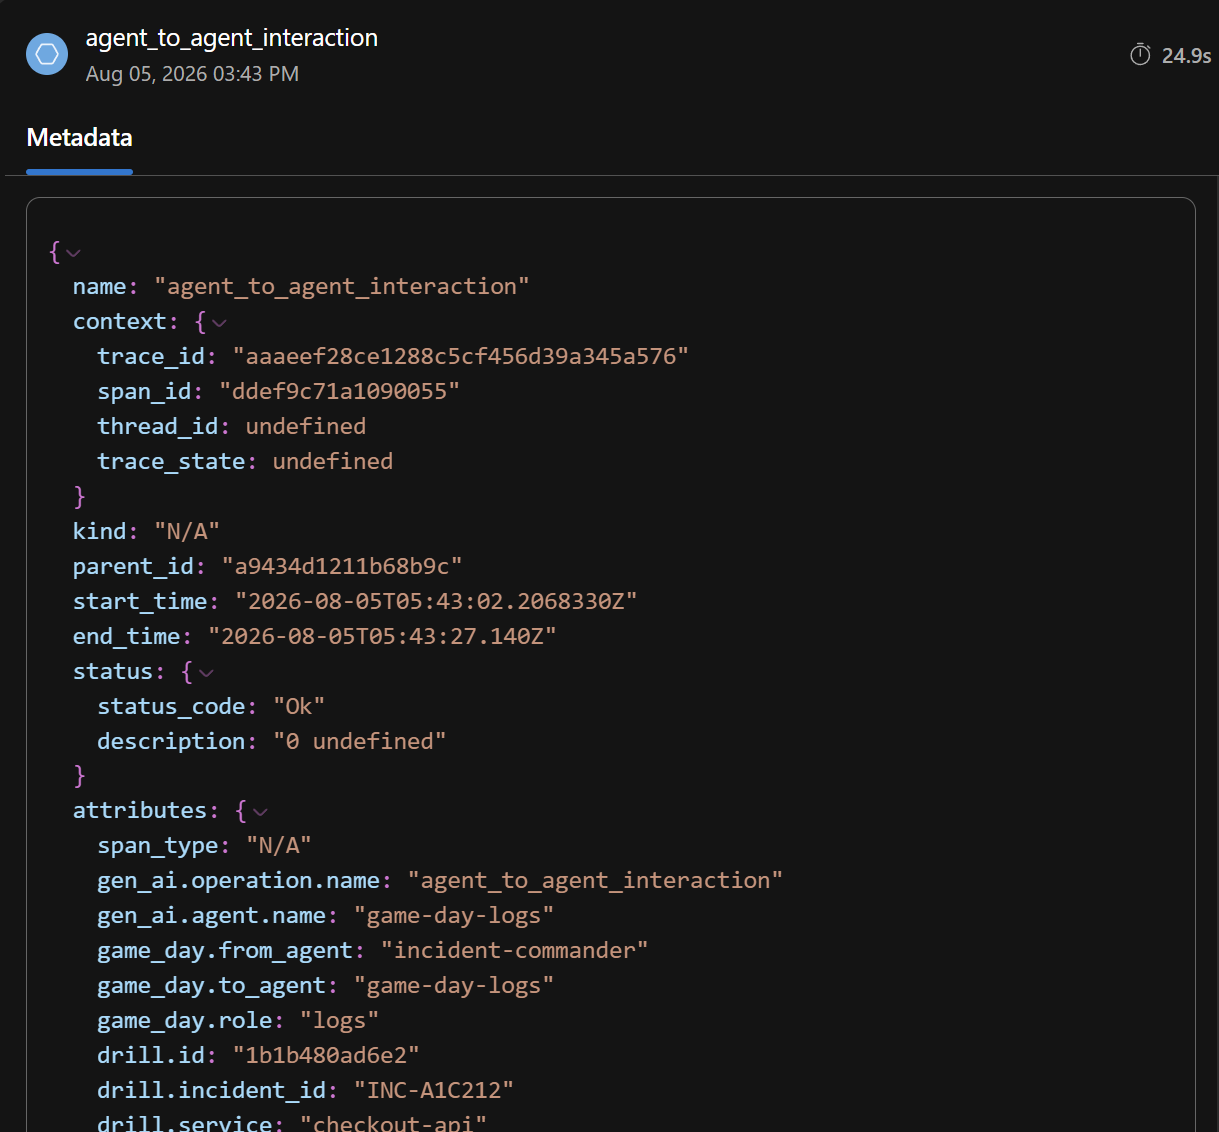
Because agent.run() sits inside this with block, the invoke_agent span that Agent Framework opens becomes a child of our hand-off span. That gives us the three levels we’ll see in the portal later: the drill, the hand-off, then the specialist’s own agent, chat and tool spans. Without it we’d have three invoke_agent spans sharing a parent and no record of who handed work to whom.
OpenTelemetry with Azure Monitor
Azure Monitor supports two approaches with OpenTelemetry. Either through its native OpenTelemetry Protocol (OTLP) ingestion path so we can send standard logs, metrics, and traces into Azure Monitor using the open source collector, or we can use the Microsoft OpenTelemetry Distro, which is a client that bundles all open-source and Microsoft components required for a full integrated experience with Azure Monitor for both AI Agents and normal applications.
To use OpenTelemetry in Python, we need to install the following dependencies:
agent-framework-foundry>=1.10.4
azure-identity>=1.19.0
# Not installed by Agent Framework. Without it there is no Application Insights exporter.
azure-monitor-opentelemetry>=1.6.0
# Copies drill baggage onto every span, which is what makes one drill one queryable unit.
opentelemetry-processor-baggage>=0.65b0
python-dotenv>=1.0.1
For the purposes of this demo, I wanted to extend the sample so that we can have the option of either seeing the traces in the console, or in Azure Monitor, so we’ll need to configure both like so:
async def configure(client: FoundryChatClient, *, sensitive_data: bool) -> str:
    otlp_endpoint = os.environ.get("OTEL_EXPORTER_OTLP_ENDPOINT", "").strip()

    if otlp_endpoint or flag("ENABLE_CONSOLE_EXPORTERS"):
        configure_otel_providers(enable_sensitive_data=sensitive_data, views=_metric_views())
        destination = otlp_endpoint or "the console"
    else:
        connection_string = (
            await client.project_client.telemetry.get_application_insights_connection_string()
        )
        configure_azure_monitor(
            connection_string=connection_string,
            resource=create_resource(),
            enable_live_metrics=True,
            views=_metric_views(),
        )
        destination = "Application Insights, via the Foundry project connection"

    # ENABLE_INSTRUMENTATION defaults to false. Without this the crew runs and emits nothing.
    enable_instrumentation(enable_sensitive_data=sensitive_data)
One thing that I noticed is that we need to add the enable_instrumentation() method in order to export our telemetry data. Agent Framework disables this by default, and while our agents will run, without this our telemetry isn’t emitted.
Another thing worth mentioning is the enable_sensitive_data parameter. This is what puts prompts, tool arguments, and tool results into the spans. It’s off by default, and it should stay off for production. This sample is just using synthetic data to show what’s possible. If you want to keep user prompts out of Application Insights, set this to false.
Building our observable multi-agent system
As I mentioned earlier, the Microsoft Agent Framework provides some of this out of the box. Once we’ve configured our instrumentation, these spans appear without any extra effort on our part. What’s lacking is what choices our agents have made.
If we wanted to see what tool calls our agent makes, we want to be able to see that within our traces. For example, for our Logging Agent, we can configure this like so:
@tool(approval_mode="never_require")
async def query_logs(
    service: Annotated[str, Field(description="Service name from the service map, for example 'checkout-api'.")],
    min_level: Annotated[str, Field(description="Lowest severity to return: info, warn or error.")] = "warn",
) -> str:
    """Read recent log lines for one service in the incident window."""
    key = _clean(service).lower()
    level = _clean(min_level).lower()
    _count("query_logs", key)

    span = trace.get_current_span()
    span.set_attribute("game_day.tool.service", key)
    span.set_attribute("game_day.tool.min_level", level)

    ...
    span.set_attribute("game_day.tool.result_count", len(lines))
    return _ok(service=key, min_level=level, lines=lines)
Let’s break this down:
@toolregisters the tool as a function within the Microsoft Agent Framework.- The
_clean()method trims and caps every argument. Our tool arguments come from a model, so it’s best to treat this as untrusted input. - The
trace.get_current_span()method grabs theexecute_toolspan that is already open. We’re not creating a new span, we are adding to the one that already exists to get that unified span. - The
game_day.tool.*attributes record what tool the agent invoked, and what it got back.
Without those attributes, we wouldn’t be able to see that the Logs agent looked at the wrong service, or that a query returned 0 results but it did some work anyway.
Seeing it work
Let’s see this in action. We can run one of the drills like so:
$ python demo.py
This produces the following output:
[1] INC-A1C212  checkout latency spike     normal  sev1      48.5 s  drill 1b1b480ad6e2
    logs       24.9 s  Checkout-api p99 latency and error spike caused by payments-gateway connection-pool exhaustion leading to timeouts and a circuit-breaker opening.
    metrics    24.4 s  ~09:25 spike in checkout-api p99 and errors, traced to payments-gateway timeouts after a 09:20 deploy that reduced its connection pool.
    runbook    12.5 s  RB-014 (Downstream connection pool exhaustion) selected; confirm pool.max vs prior release and restore it if it was lowered.
    commander  routed to grok-4-1-fast-reasoning
    tool calls  lookup_runbook 1  query_logs 4  query_metrics 6    total 11

     - ~09:20: Deploy to payments-gateway reduced connection pool max from 200 to 20 (Metrics).
    - ~09:25: p99 latency jumps in payments-gateway (90ms to 7.66s) and checkout-api (~360ms to 1.9s then 7.9s), with error rates rising to 17% and 15% respectively; request volumes flat then falling (Metrics).
    - payments-gateway connection pool saturated: in_use=20 max=20 waiters=61, then pool acquire timed out after 8000ms with waiters=112 (Logs).
    - checkout-api slow downstream calls to payments-gateway: duration_ms=6902 (Logs).
    - checkout-api upstream timeouts on payments-gateway after 8000ms (Logs).
    - Circuit breaker opened on payments-gateway dependency after 23 failures (Logs).

    RB-014 "Downstream connection pool exhaustion" matches symptoms of latency step change, flat-then-falling volume, and upstream timeouts. Confirm current pool.max value against the previous release; since metrics evidence shows it was reduced from 200 to 20 by the 09:20 deploy, raise it back to 200 or roll back the release. Monitor p99 latency, error rates, and pool metrics post-mitigation to confirm recovery.

    SEVERITY: sev1
The header line shows the root span duration (48.5s). All 3 agents ran concurrently and have returned their findings back to, or reported back to, the incident commander. We can see that the Commander agent uses grok-4-1-fast-reasoning to produce the timeline and a mitigation path.
Within the tool calls, we can see how many calls each agent made to various tools, along with a total.
Within the classic Foundry portal, we can see the entire game_day_drill trace in the Tracing portal. Our run generated a trace ID aaaeef28ce1288c5cf456d39a345a576:
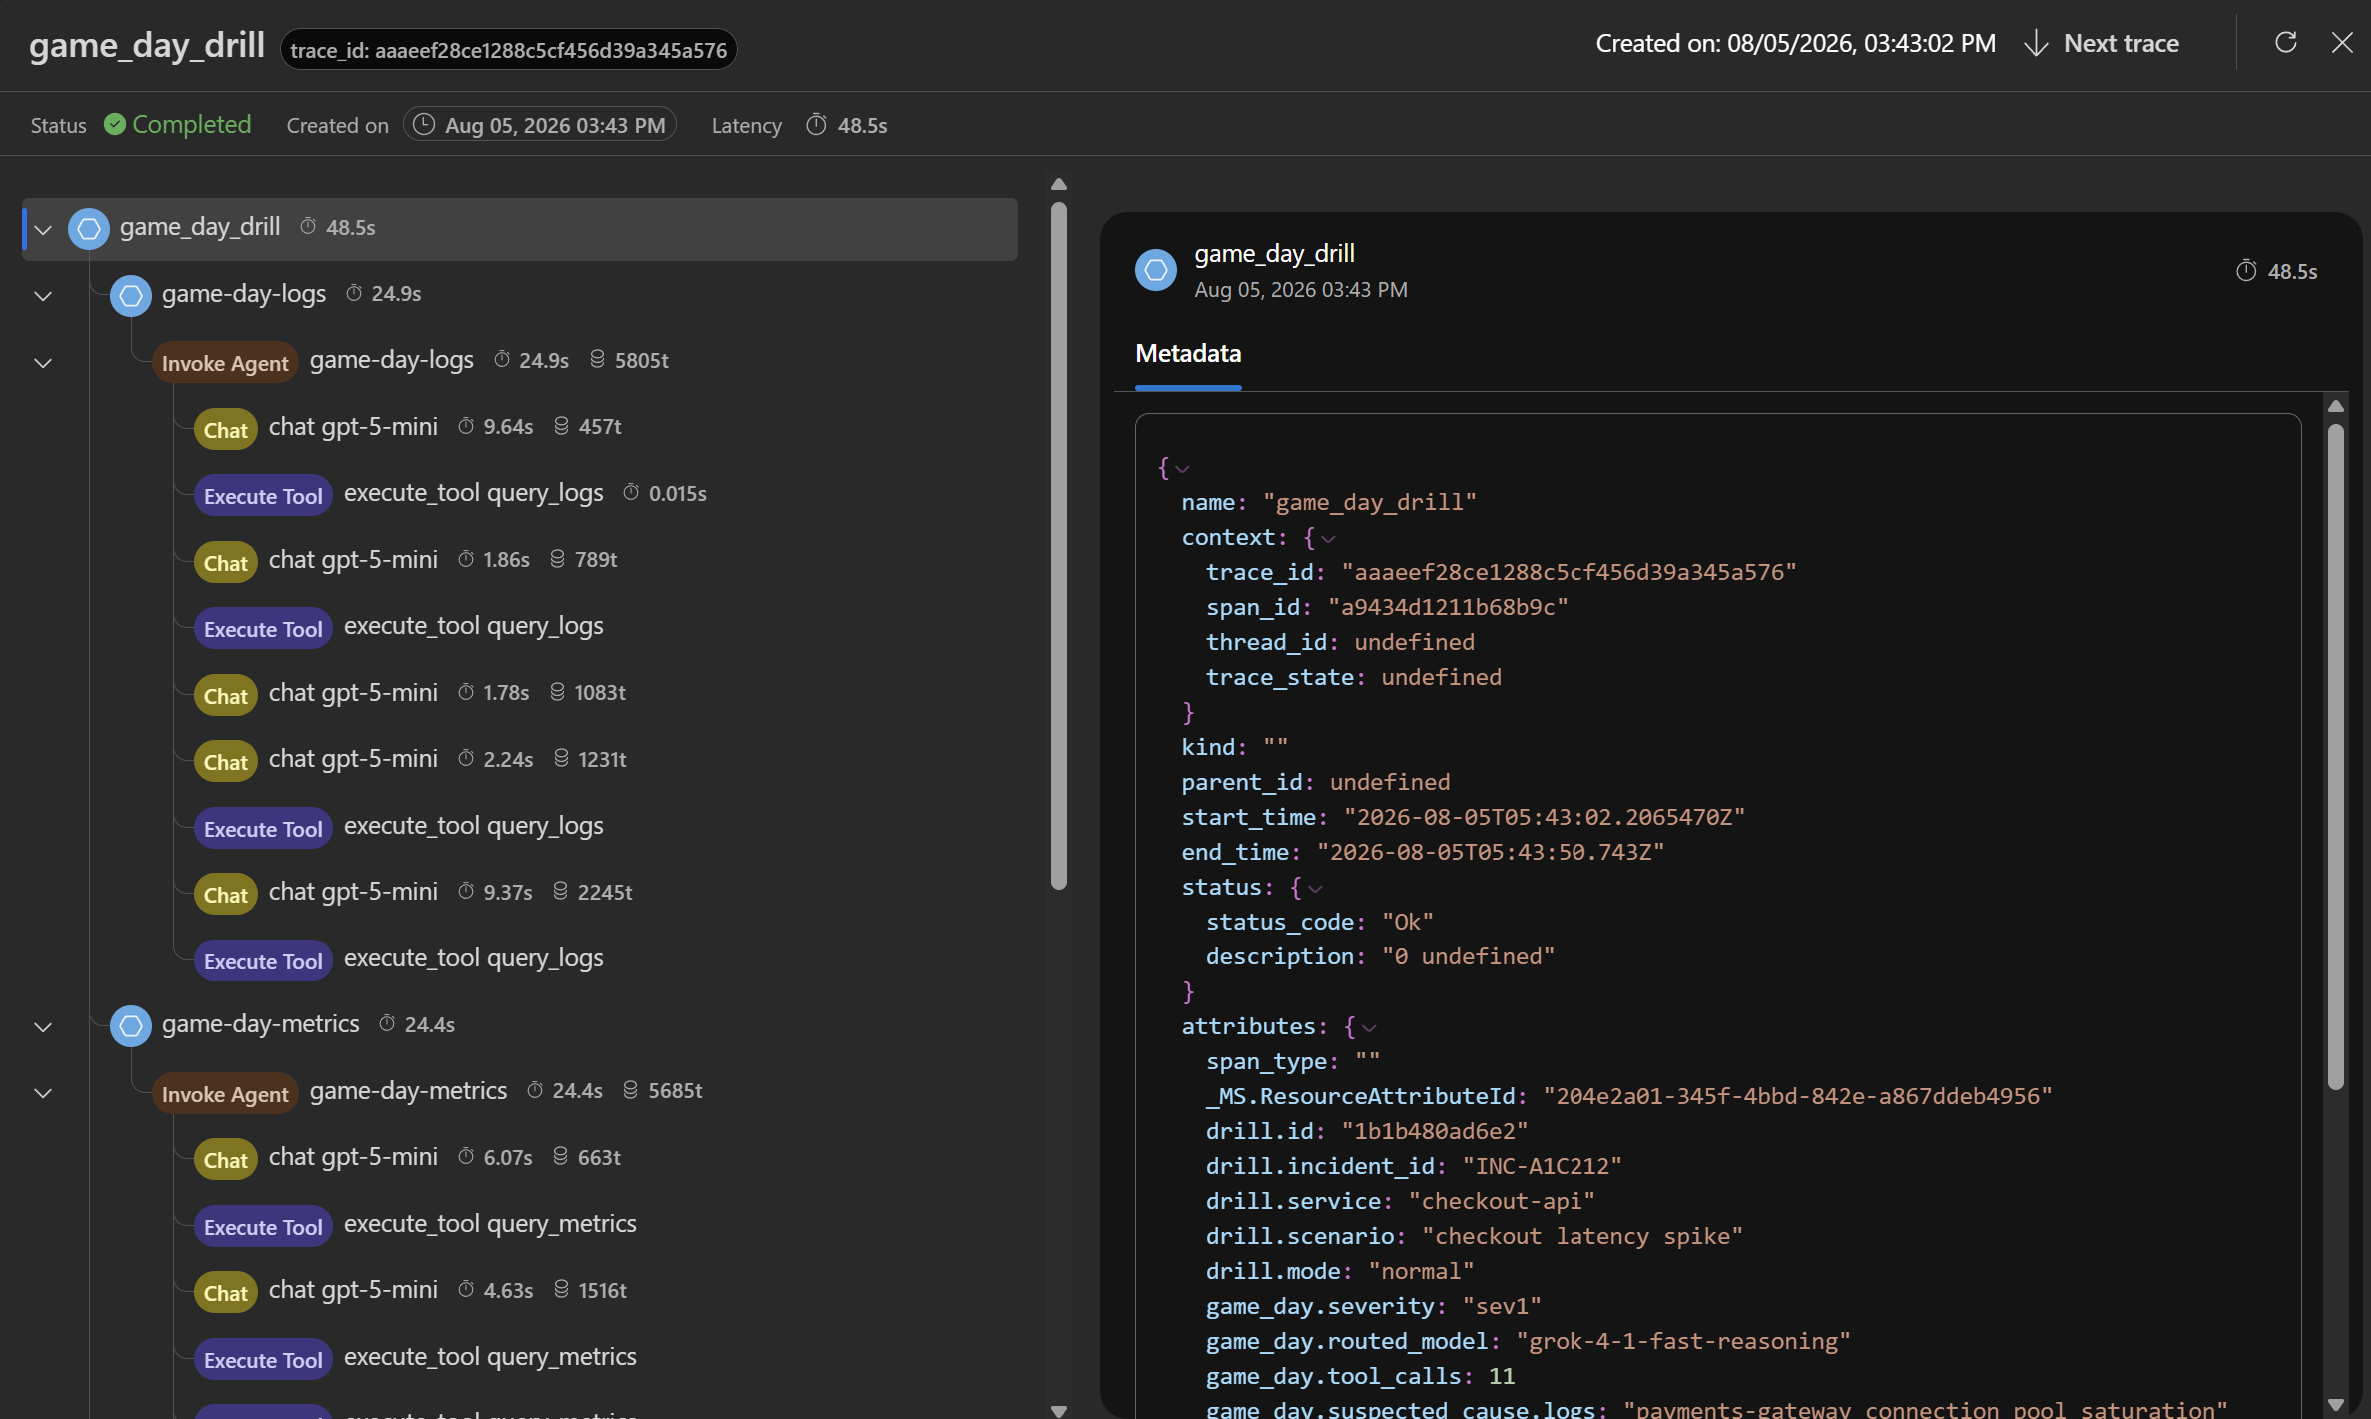
Taking a closer look at this, we can see that the child spans all use the same trace_id, so looking at the metadata of game_day_logs, it uses a new span_id, but has the same trace_id:
We can also view the entire transaction in Application Insights’ Transactions using that trace_id:
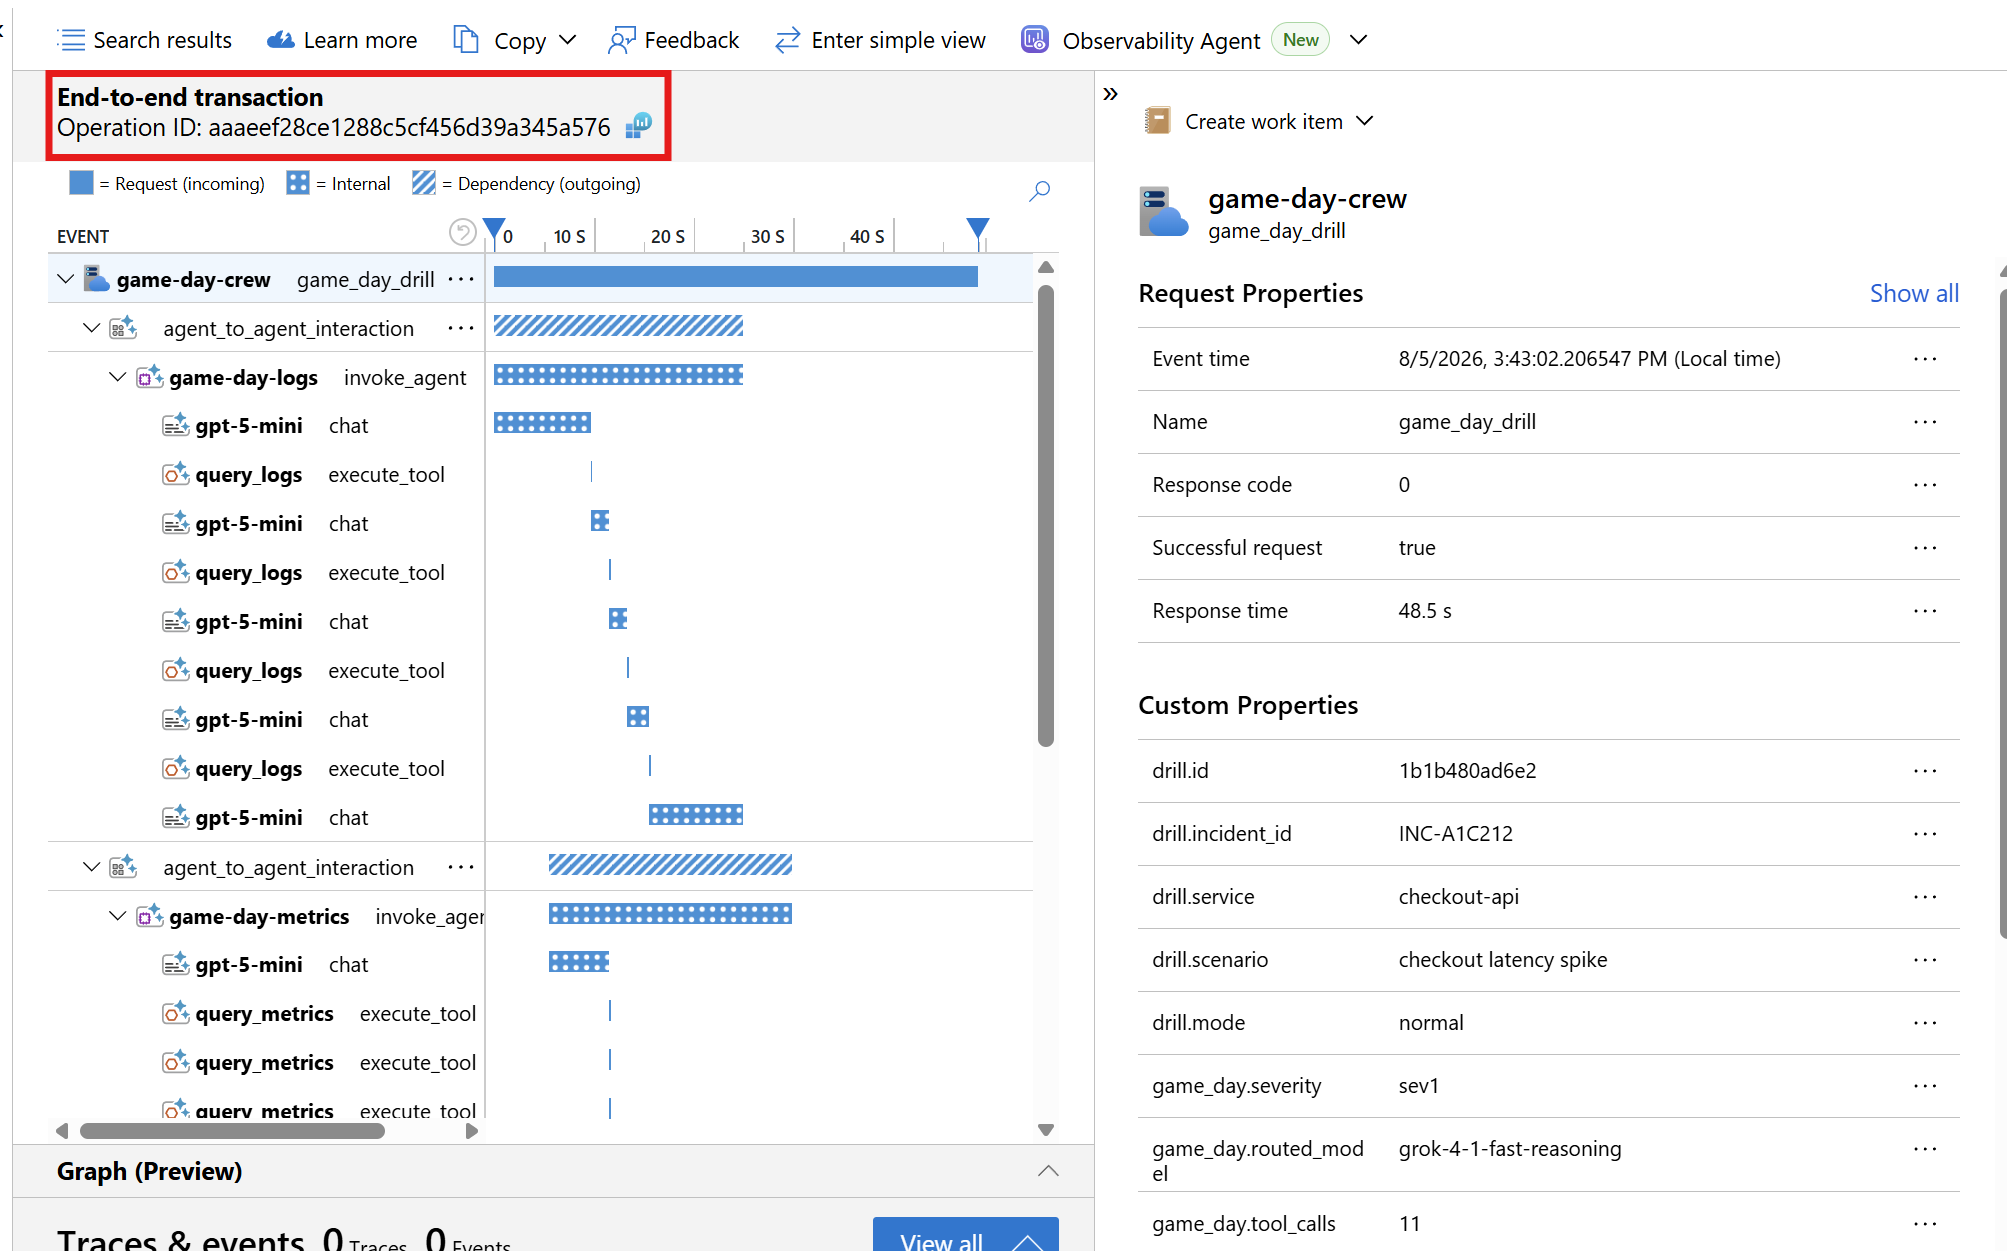
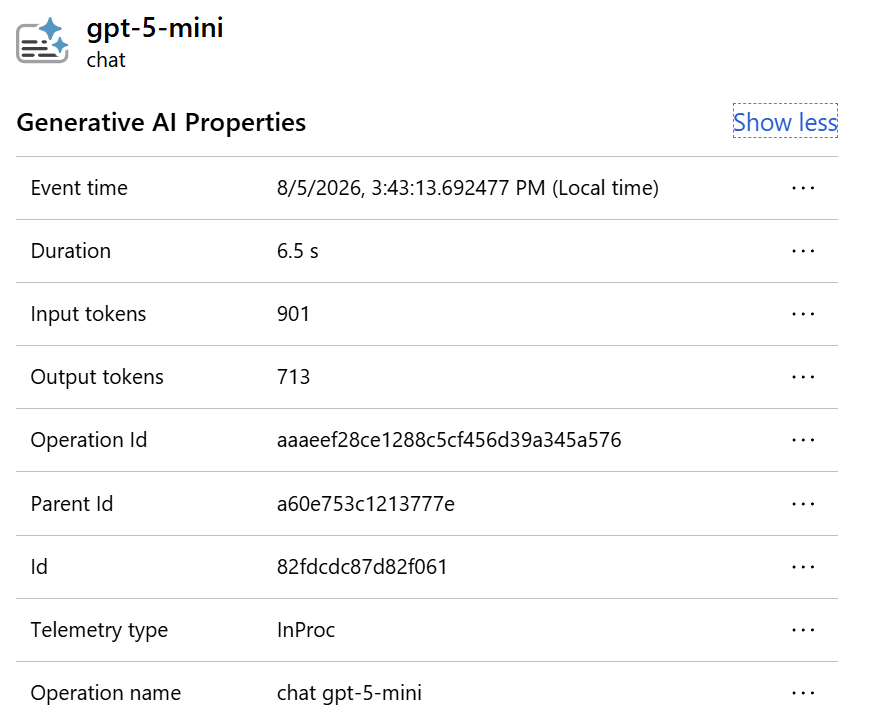
When models are invoked, we can view GenAI properties such as input and output tokens spent, as well as how long the call took:
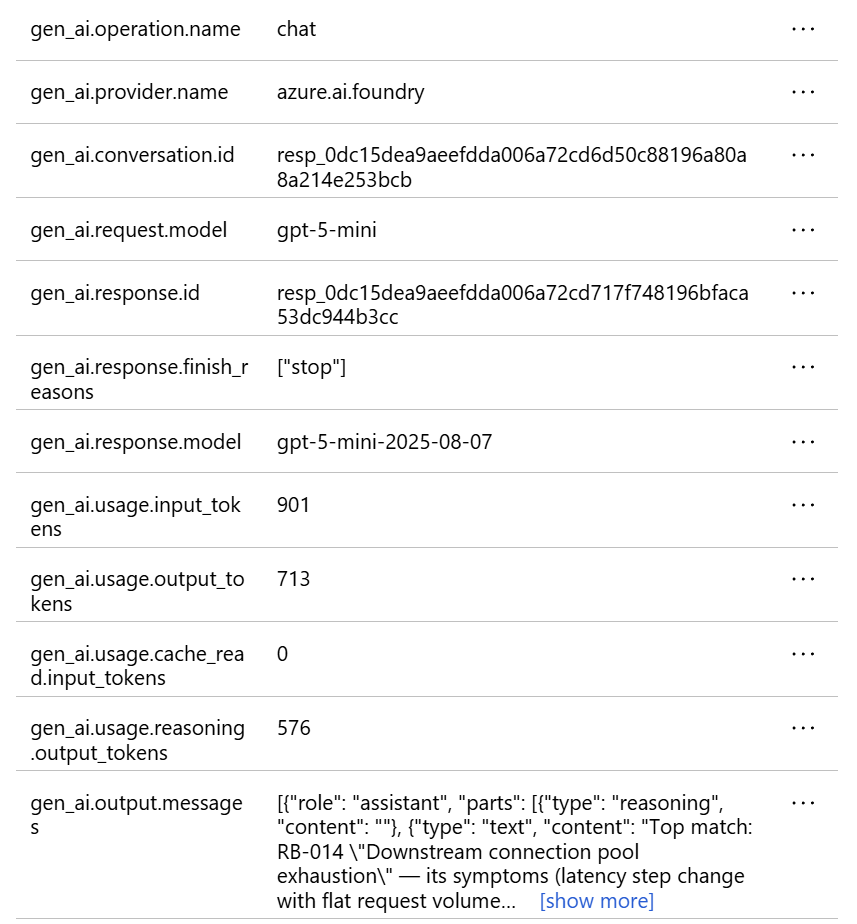
We can also view custom properties:
Application Insights has a preview feature where we can also view operational metrics from our agents, such as Agent runs, tool calls, models used and importantly, token consumption by model and input vs output tokens.
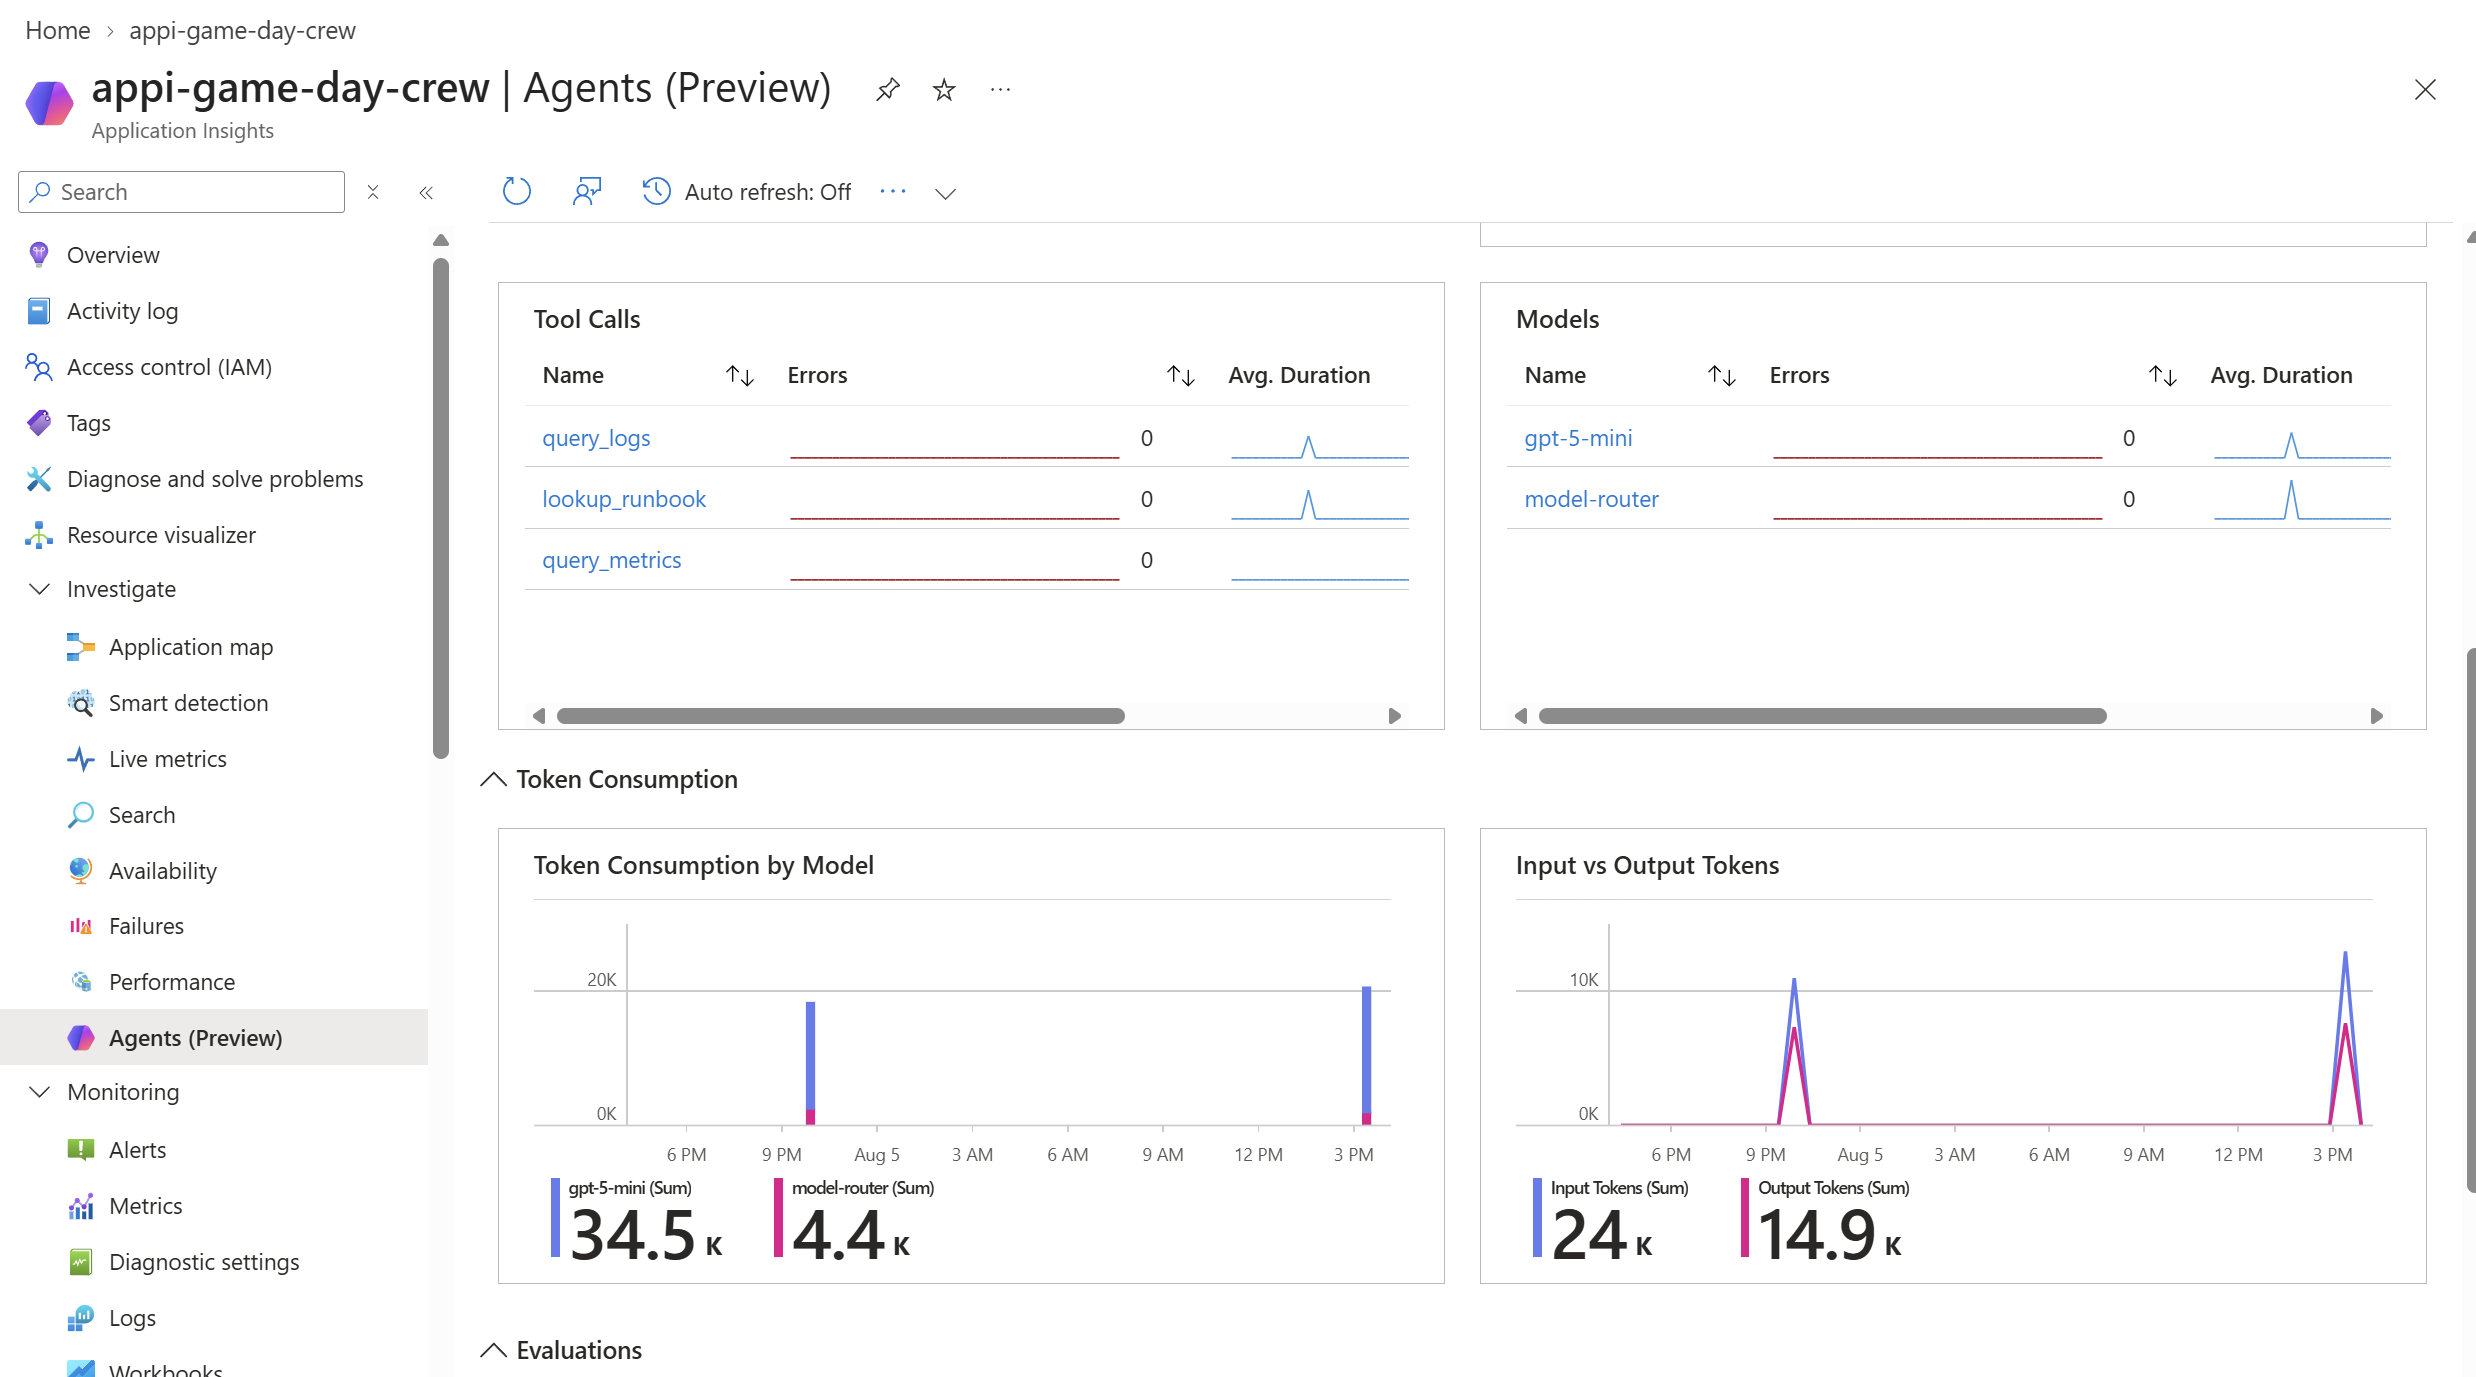
From here, we can explore specific agent runs using our trace_id from before. This is handy for when we want to start with a high-level overview, and then drill down into our transaction view.
Conclusion
Hopefully you now have a better understanding of how we can use OpenTelemetry to create a unified trace for distributed multi-agentic systems. Using this unified trace, we can gain insights into how agents interact with each other, what decisions they make, and how they consume tokens.
If you want to take a closer look at the code, the complete sample is available on my GitHub.
If you have any questions about this, please feel free to reach out to me on BlueSky!
Until next time, Happy coding! 🤓🖥️